
By Nathan Zhang – Thermal Design Workshop Series
Fans are often treated as a last‑minute checkbox in thermal design: “add a fan and hope for the best.” In reality, fan performance is deeply rooted in fluid mechanics, system resistance, and practical trade‑offs between airflow, pressure, noise, reliability, and control.
This article distils the essential learnings from my Thermal Design Workshop Series – Fans, with a focus on why fans work, how to select them correctly, and what really determines cooling performance in real products.
Why a Fan Helps: It’s About Boundary Layers, Not Just Airflow
The primary purpose of a fan is not just to move air, but to increase the heat transfer coefficient (h).
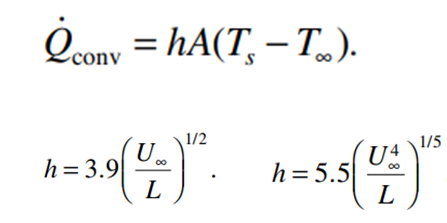
Air is a poor thermal conductor. On a hot surface, stagnant air forms a thermal boundary layer that resists heat transfer.
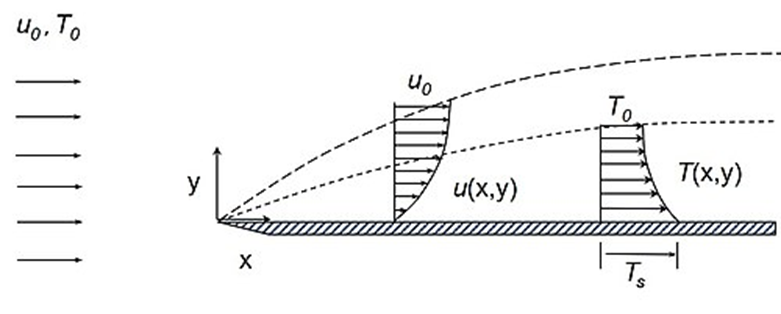
When airflow velocity increases:
- The boundary layer becomes thinner
- Heat is convected away more efficiently
- The effective heat transfer coefficient increases significantly
🔑 Key insight: High local air velocity matters more than raw airflow numbers.
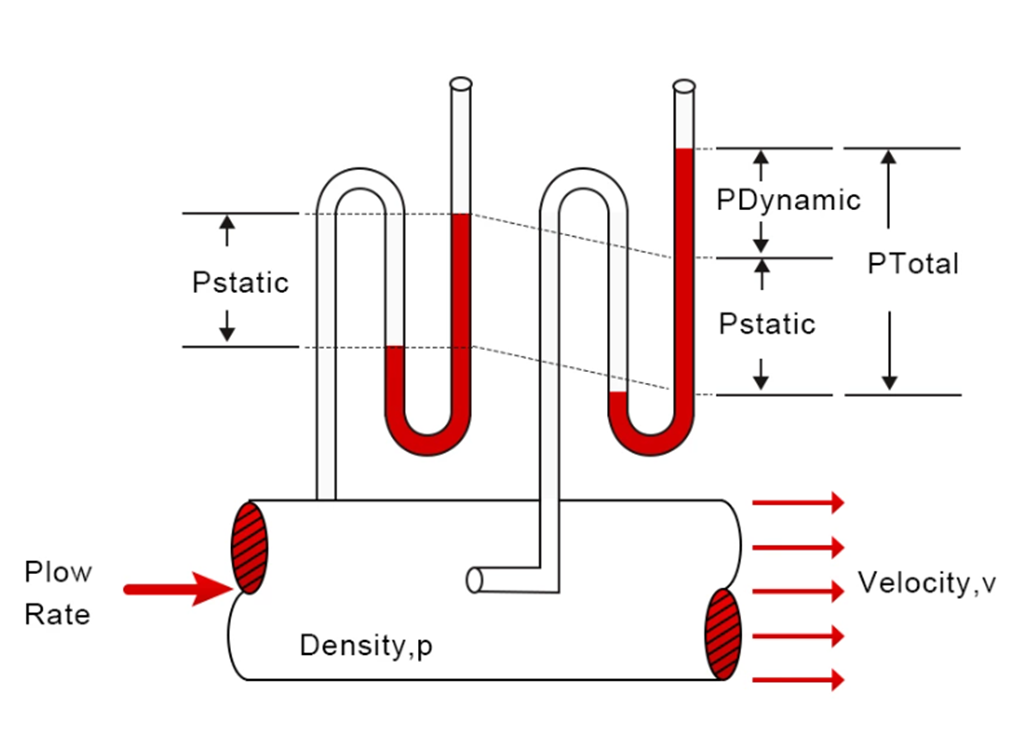
Static Pressure, Dynamic Pressure, and Bernoulli’s Principle (In Plain English)
Air pressure in a moving system has two components:
- Static pressure: the pressure that overcomes system resistance
- Dynamic pressure: the pressure associated with air velocity
According to Bernoulli’s Principle:
Total pressure = Static pressure + Dynamic pressure (constant in a closed system)
As system resistance increases:
- Static pressure rises
- Air velocity (and airflow) drops
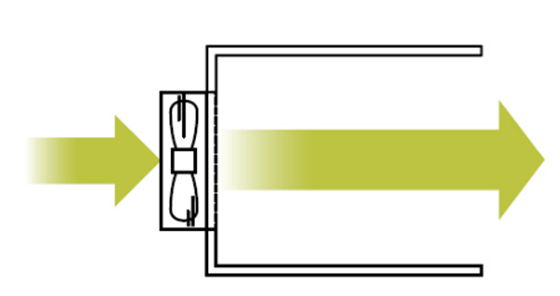
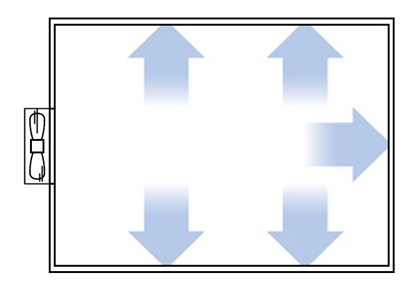
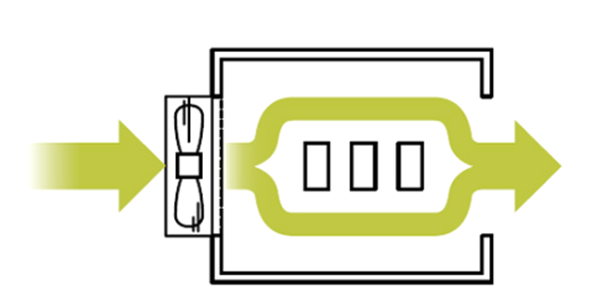
This is why airflow collapses when a fan is placed behind restrictive vents, dense heat sinks, or poor internal layouts.
Understanding the Fan Curve: Max Airflow vs Max Static Pressure
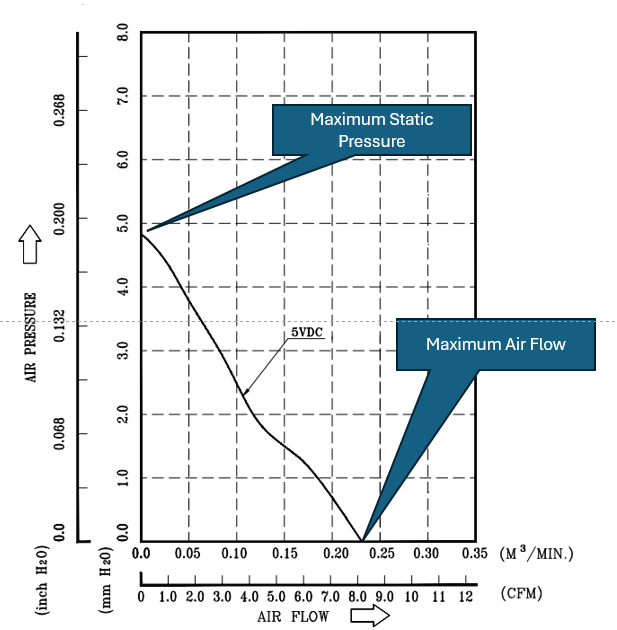
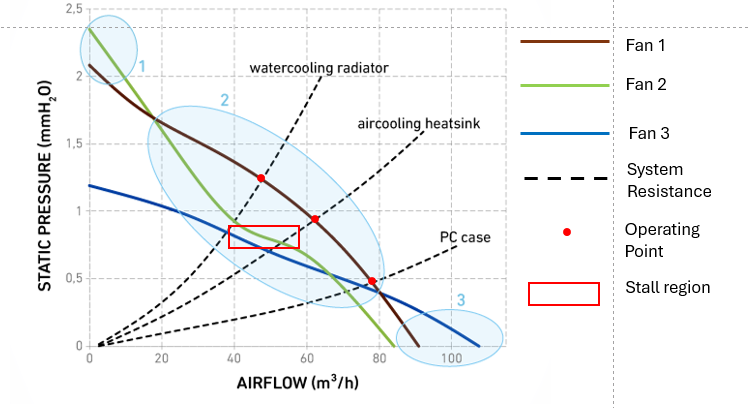
Every fan has a P–Q (pressure–flow) curve, which tells us:
- Maximum airflow occurs at zero static pressure (free air)
- Maximum static pressure occurs at zero airflow (blocked condition)
In real products, the fan always operates somewhere in between.
📌 The true operating condition is defined by:
The intersection of the fan curve and the system resistance curve
This is the operating point — and it determines the actual airflow in your product.
What Else the Fan Curve Tells Us
1. Not all fans behave the same
- At the same resistance, one fan may deliver significantly higher airflow than another
- A fan that looks “strong” in free air may perform poorly in a restrictive system
2. Beware the stall region
- Operating in the stall region leads to: Flow instability High noise Severely degraded performance
✅ A good design keeps the operating point well away from stall.
3. You cannot guess system resistance
For real electronic products:
- Air paths are complex
- Manual calculations are rarely accurate
👉 CFD simulation or wind tunnel testing is the most reliable way to obtain the system resistance curve.
Fan Laws: Speed Changes Everything
Fan laws describe how performance scales with speed:
- Airflow ∝ RPM
- Pressure ∝ RPM²
- Power ∝ RPM³
- Noise increases rapidly with speed
This explains why:
- Small speed increases can dramatically raise noise and power
- Overspeeding a fan is almost never efficient
🔍 Design lesson: Use speed wisely — don’t brute‑force cooling with RPM.
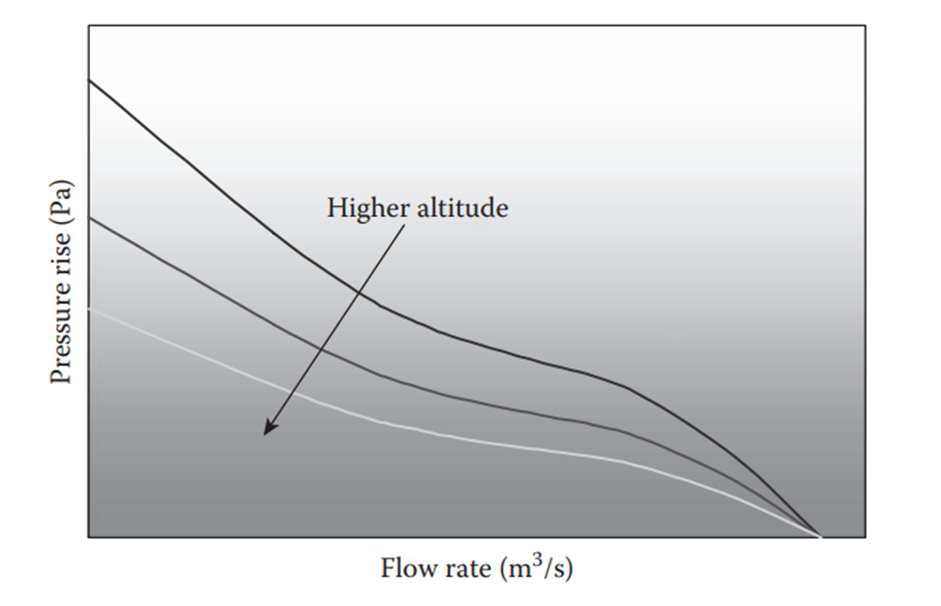
Why the Same Fan Behaves Differently in Different Places
Air density matters.
At high altitude:
- Air density decreases
- The same fan moves less mass of air
- Cooling capacity drops
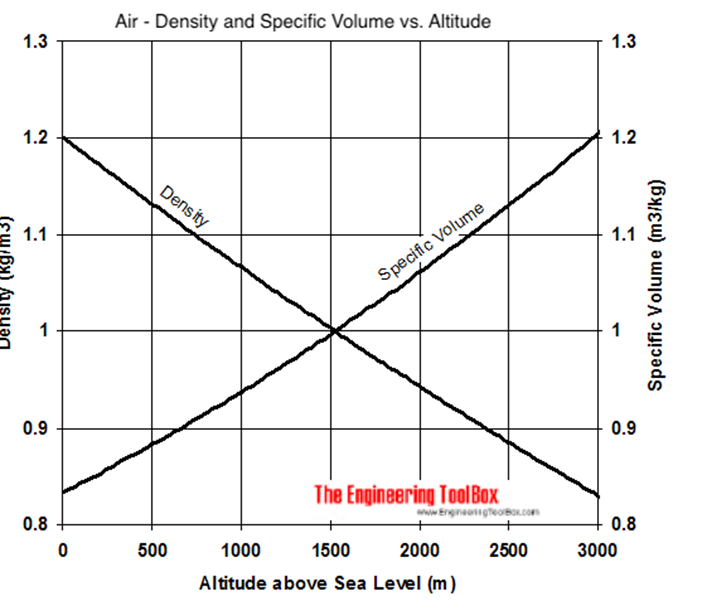
From basic heat capacity:
Q=PΔT⋅ρ⋅CpQ = \frac{P}{\Delta T \cdot \rho \cdot C_p}Q=ΔT⋅ρ⋅CpP
Lower density means higher required airflow to remove the same heat.
✅ Rule of thumb: Always validate thermal performance at altitude with testing, not just calculations.
A Practical Fan Selection Workflow
Step 1: Define Boundary Conditions
- System power dissipation
- Ambient temperature
- Maximum allowable component temperature
Step 2: Preliminary Airflow Calculation
Estimate required airflow using:
Q=PΔT⋅ρ⋅CpQ = \frac{P}{\Delta T \cdot \rho \cdot C_p}Q=ΔT⋅ρ⋅CpP
⚠️ Important:
- This gives a minimum estimate
- Real airflow will be lower due to losses
Step 3: CFD Simulation
- Determine system resistance curve
- Match fan curve to find the operating point
- Validate airflow distribution and hot spots
💡 Never rely on free‑air CFM numbers alone.
Bearings Matter: Reliability vs Noise
Sleeve Bearings
✅ Low cost ✅ Low noise ❌ Limited life at high temperature ❌ Orientation‑sensitive
Best for: office equipment, light‑duty electronics
Ball Bearings
✅ Long life ✅ High‑temperature capability ✅ Operate in any orientation ❌ Higher cost ❌ Higher noise
Best for: servers, industrial systems, high‑duty applications
Fan Control: 2‑Wire, 3‑Wire, or 4‑Wire?
- 2‑Wire: Fixed speed, simplest
- 3‑Wire: Speed monitoring (tachometer)
- 4‑Wire (PWM): Precise speed control with constant voltage
Modern systems increasingly rely on PWM control for efficiency, acoustics, and reliability.
Fan Tuning: Why Speed Control Is Essential
Smart fan control enables:
- ✅ Lower power consumption
- ✅ Longer fan life
- ✅ Reduced dust accumulation
- ✅ Lower acoustic footprint
Common approaches:
- Constant speed
- Temperature‑based ramp
- Multi‑step profiles
- Full PID control
Good fan tuning turns thermal management from reactive to predictive.
Key Takeaways
- Physics first: Velocity improves heat transfer; pressure overcomes resistance
- Boundary layers matter more than raw airflow
- CFD is essential — don’t guess operating points
- Select bearings for life, not just cost
- Design for acoustics, not just temperature
- Altitude can make or break performance