
By Nathan Zhang | Thermal Design Workshop Series 4 — Heat Sink
As power density rises and form factors shrink, thermal decisions must move beyond datasheet browsing to system‑level thinking and real validation. The most reliable designs combine sound physics, compact thermal models, and early prototype evidence—so thermal management becomes a competitive advantage, not a late‑stage redesign.
1) The Fundamentals That Actually Move the Needle
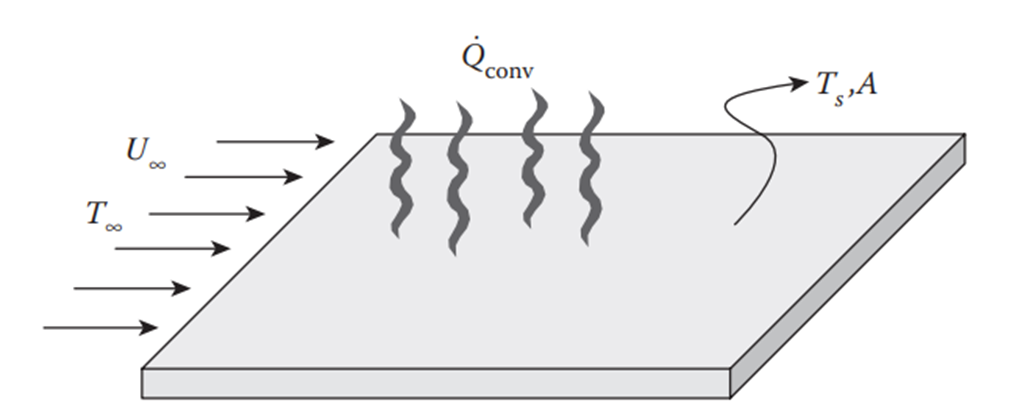
Convection (Newton’s law of cooling). In electronics, the heat‑transfer coefficient h varies widely with flow regime and geometry. Typical ranges for air are roughly:
- Natural convection: ~3–20 W/m²·K
- Forced convection: ~30–300 W/m²·K (often higher as turbulence and velocity increase)
These ranges explain why moving from still air to well‑managed forced airflow can reduce thermal resistance by multiples.
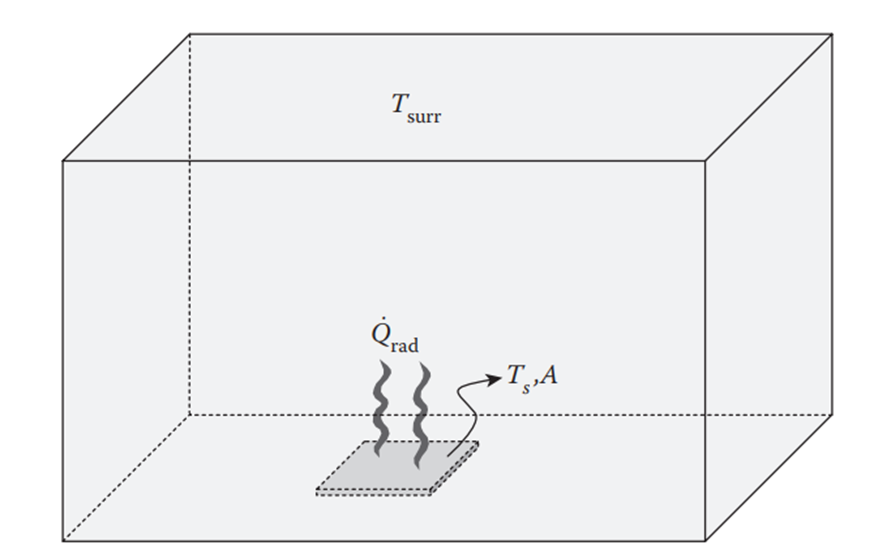
Radiation. At elevated temperatures, radiation contributes meaningfully. It depends on area, temperature difference to surroundings, and emissivity. Surface finish matters: polished aluminum has low emissivity (~0.04–0.06), while black anodized aluminum is much higher (~0.8–0.9), which can improve radiative heat loss—especially in natural‑convection designs.
2) What Really Drives Heat Sink Performance
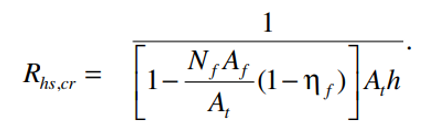
Total heat‑sink thermal resistance is a stack‑up:
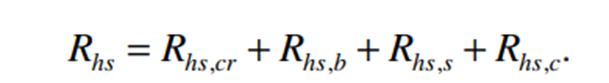
- Convection + radiation at fins/surfaces
- Base conduction
- Spreading resistance
- Interface (TIM + contact) resistance
Treat these as a budget. The biggest gains typically come from:
- Raising h and improving airflow quality
- Ensuring secure fin‑to‑base conduction
- Minimizing interface/contact resistance through compliant TIMs, uniform clamping, and thin bond lines
3) Interpreting Heat‑Sink Datasheets Correctly
What the numbers mean. Most heat‑sink datasheets publish sink‑to‑air thermal resistance (R_sa) under specific test setups. R_sa is not a constant—it changes with airflow quality, orientation, heat‑source size, surface finish, and the interface to the sink.
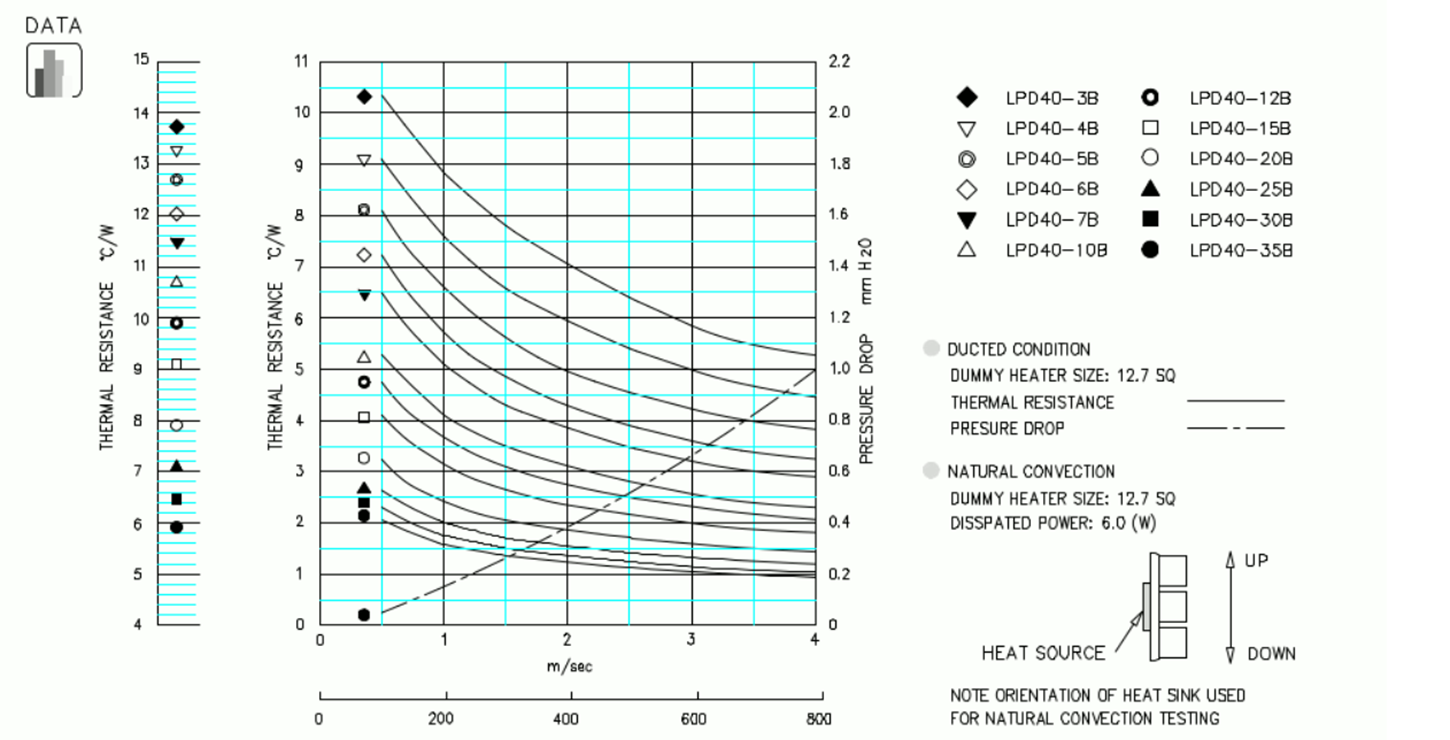
Typical test conditions (why your results differ):
- Natural convection: Often measured in still air with the heat sink vertical, unobstructed, and with a uniform, heated base. Real enclosures add walls, cable bundles, and nearby hot parts that disrupt buoyant plumes.
- Forced convection: Rated at specified air velocities and uniform, ducted flow. In products, the velocity profile is rarely uniform; grilles, bends, and upstream components raise system resistance and shift the fan operating point.
- Heat‑source footprint: A small die or package on a thick base spreads heat differently than a large module; the spreading resistance changes with base thickness, material, and source area.
- Interface quality: TIM type, bond‑line thickness, clamping pressure, and flatness can add contact resistance that’s not reflected in R_sa.
- Surface finish: Black anodizing increases emissivity and can meaningfully help natural‑convection performance; polished aluminum radiates poorly.
How to use the datasheet (screening, not sign‑off):
- Match test to reality: Note the datasheet’s orientation and airflow (velocity or “still air”) and compare to your enclosure. If your sink is horizontal or partially blocked, expect higher R_sa.
- Estimate local velocity: If you have forced air, determine surface velocity at the fins (from fan–system analysis or CFD). Ratings at 2–3 m/s won’t hold if your plenum only delivers 0.5–1 m/s.
- Adjust for source size and base: If the IC footprint is much smaller than the base, consider spreading resistance—thin bases under‑deliver; thicker copper/aluminum bases improve uniformity.
- Account for TIM/contact: Use realistic bond‑line thickness and pressure in your calculations; thin, well‑wetted interfaces can remove several °C/W from the stack.
- Validate early: Use datasheets to shortlist candidates, then prototype (or run targeted CFD) in your actual orientation and airflow. Measure temperatures at the package top/board/sink to confirm the selection before the engineering build.
Practical takeaway: Treat R_sa as scenario‑dependent. It’s a great screening metric, but your final choice should reflect your airflow, orientation, source size, and interface quality—then be validated with measurement.
4) A Simple User Case: Why the Right Heat Sink Matters
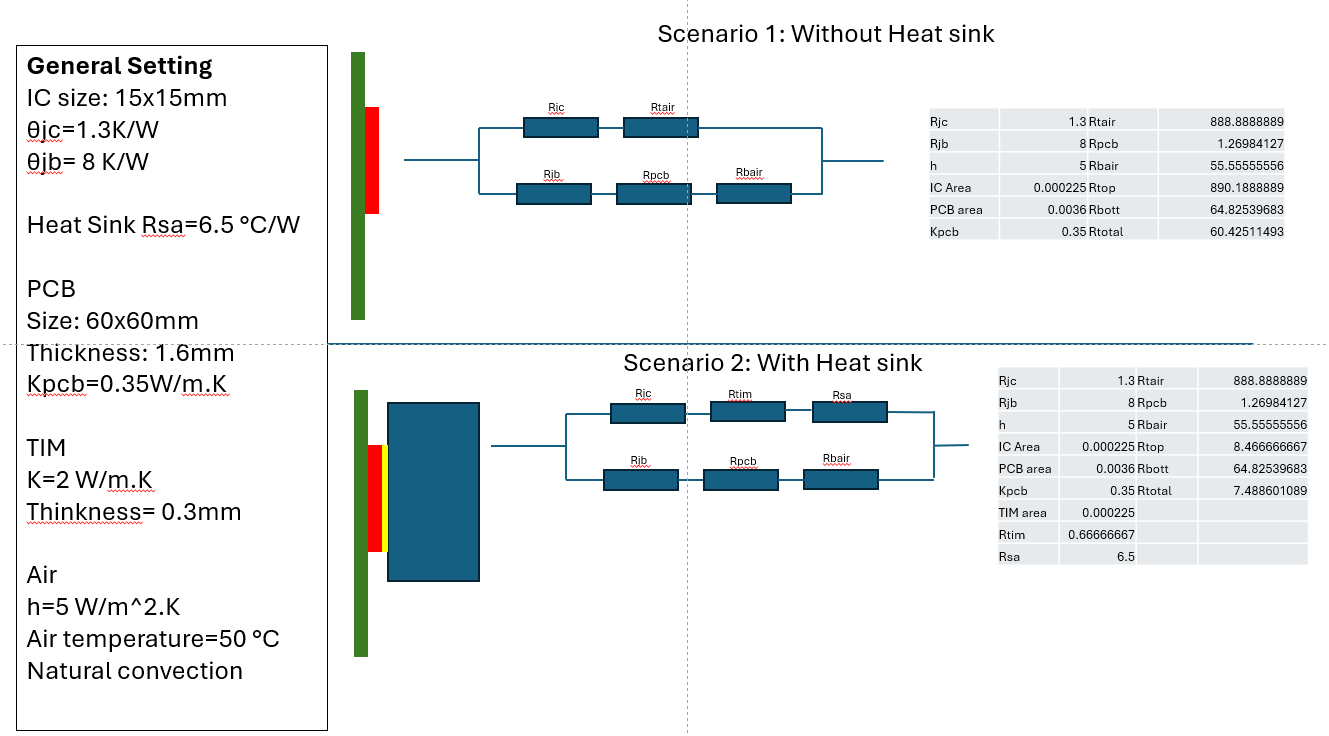
Setup (natural convection):
- IC: 15 × 15 mm, θ_jc = 1.3 K/W, θ_jb = 8 K/W
- PCB: 60 × 60 mm, 1.6 mm FR‑4, k ≈ 0.35 W/m·K
- TIM: k = 2 W/m·K, thickness = 0.3 mm
- Air: h ≈ 5 W/m²·K, T_air = 50 °C
- Heat sink: R_sa ≈ 6.5 °C/W
Results:
- Without heat sink: R_total ≈ 60.4 °C/W
- With heat sink: R_total ≈ 7.5 °C/W
Adding the heat sink reduced thermal resistance by almost an order of magnitude—consistent with the impact of increased area, improved h, and higher emissivity.
5) Selection Workflow That Holds Up in the Lab
- Quantify power density (heat flux) and set junction limits; sketch a resistance budget from junction to ambient.
- Choose convection mode (natural vs. forced) based on enclosure realities; forced airflow typically lifts h by ~10×.
- Translate datasheet metrics with a compact thermal model to your board and ambient context.
- Run flow simulations for geometry/orientation effects and pressure drops; follow verification/validation best practices (mesh independence, benchmark cases, and experimental correlation).
- Prototype early (Pre‑EV), instrument junction proxies, board points, and heat sink surfaces; iterate TIM, clamping, and fin geometry.
- Select catalog sinks that match validated airflow and orientation; treat R_sa as screening data—not sign‑off.
- If forced air is used: size fans at the system curve–fan curve intersection (not free‑air CFM), and avoid stall regions for stability and noise.
6) Natural‑Convection Geometry: Fin Spacing Matters
For vertical plate‑fin sinks in still air, there is an optimum fin spacing: too close throttles buoyant flow; too wide sacrifices area. Use empirical or CFD‑guided optimization for your specific fin height, thickness, and temperature difference. As a starting point in many medium‑sized sinks, spacing near the single‑digit millimeter range often aligns with optimum plume development—then validate on your geometry.
Orientation: Vertical, unobstructed inlet/outlet paths generally outperform horizontal orientations in free convection, because buoyant plumes develop more cleanly.
7) Forced Convection: Fans, Pressure, and Altitude
Fan selection = pressure + flow. Your fan’s operating point is where the fan curve meets your system curve (often ~square‑law). It must land outside the stall region for stable operation and acceptable acoustics.
Altitude and density corrections. At higher altitudes, the same CFM carries less mass flow. Apply air‑density corrections to static pressure and motor power when sizing; expect to increase flow (or fan speed/size) to achieve the same cooling capacity as sea level.
8) TIMs: Make Contact Resistance a First‑Order Design Variable
- Reduce contact resistance with compliant gap fillers or greases that wet surfaces and tolerate stack‑up; clamp uniformly to achieve thin bond lines.
- Match TIM type to use case: Greases/PCMs for very thin lines and flat, rigid surfaces Gap fillers for multi‑device coverage and tolerance absorption Metallic TIMs (e.g., indium) when ultra‑low resistance and permanence are needed
Measure total interface resistance in prototypes; the contact terms frequently dominate unless wetting and pressure are well controlled.
9) Common Heat‑Sink Types: Strengths and Trade‑Offs
- Extrusion: Low cost, high conductivity; typically lower fin aspect ratios
- Die‑casting: Complex shapes; lower conductivity than extrusion; often lower aspect ratios
- Bonded/folded fin: High aspect ratios and performance at higher cost; mixed base/fin materials require excellent contact
- Swaged/skived: Strong fin‑to‑base contact; skiving supports high fin aspect ratios at attractive cost
10) Pre‑Commit Checklist
- Convection mode and realistic h range for your enclosure and orientation
- Material and surface finish: use black anodizing where radiation helps
- Base thickness and spreading: avoid bases so thin they elevate spreading resistance
- TIM selection and clamping: design for wetting and thin bond lines; measure total interface resistance
- CFD + prototype validation: correlate simulations to measurements before sign‑off
- Fan–system match (if forced): select operating points on stable curve regions; apply altitude/density corrections
Closing Thought
The “right” heat sink is the outcome of a disciplined workflow: realistic h, geometry tailored to your flow regime, interfaces that minimize contact resistance, and designs verified by simulation and prototype data. Treat thermal resistance as a budget, validate your assumptions, and test early—so thermal management becomes a strategic enabler rather than a constraint.